

Hedge Funds Cautiously Optimistic Heading into Q3
Hedge Funds Cautiously Optimistic Heading into Q3
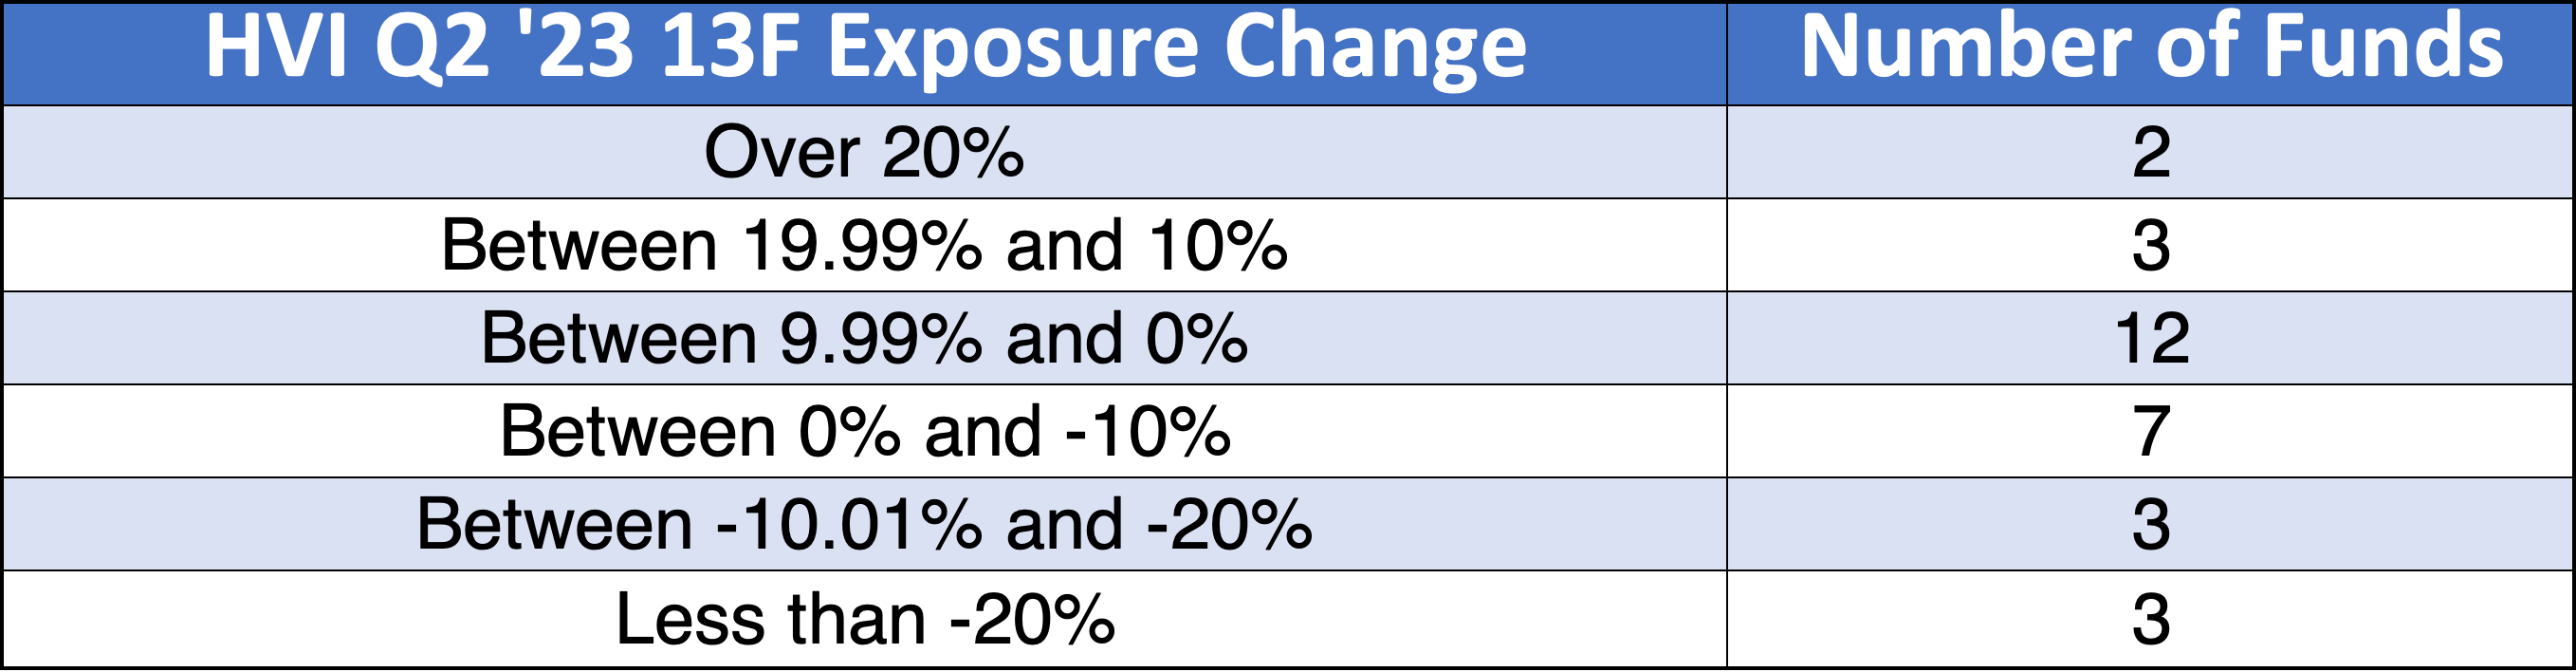
17 of the 30 hedge funds tracked by the HVI increased their market exposure during Q2

Summary:
Hedge funds tracked by the HVI returned 13% during Q2 compared to the average industry return of 2.77%.
HVI hedge funds increased their overall 13F market exposure by an average of 4.31% during the quarter.
However, Appaloosa skewed the results to the upside with its overall 13F increase of 165%.
During the second quarter, the S&P 500 notched a 7.9% return while the Nasdaq 100 increased by 15.4%. These returns were driven by cooling inflation, better than expected earnings, and elevated institutional buying, as tracked by the Hedge Vision Index (HVI).
The HVI consists of a sample of 30 hedge funds with a history of outperformance, which provides a gauge of market exposure among top funds. Each of the funds must have an average holding period of at least 4 quarters in order to improve the accuracy of the estimation.
Next, I use their estimated quarterly 13F profit or loss and combine it with the change in their holdings value, which captures net buys/sales, to calculate the overall estimated increase/decrease in market exposure. A high number of funds increasing their exposure is a bullish signal, while a high number of funds decreasing their exposure is a bearish signal
Hedge Vision Index (HVI)

During Q2, the average fund in the HVI returned 13%, compared to the industry-wide return of 2.77%. In addition, the average HVI fund increased its 13F AUM by 17.31%, amounting to an overall exposure increase of 4.31%. Sounds bullish, right?
Not so fast. If you take out Appaloosa’s mind-boggling overall 13F AUM increase of 165.12%, then the average HVI fund returned 12.77% while increasing its 13F AUM exposure by 11.54%, amounting to an overall exposure decrease of 1.23%. In other words, Appaloosa itself flipped the results from positive to negative
The results weren’t all too surprising, given the generous returns of Q2 and that all 30 of the funds tracked by the HVI increased their overall market exposure during Q1, providing an extremely bullish signal.
Ed Bosek’s BeaconLight Capital led the HVI with a Q2 return of 24.95%. These returns were enough for Bosek to take some profits, as his overall 13F exposure decreased by 10.07%.
Appaloosa, Night Owl Capital, Coatue, SRS Investment Management, and Whale Rock topped off the list as the leaders in overall 13F change. All five of these funds have excellent track records of investing before large market moves to the upside.
With the market roaring higher this year, fund managers are likely taking some risk off the table by realizing gains. Seasonality could also factor into this decision, as we are currently in the midst of a pre-election year. During this time period, the market usually reaches a bottom between August and September before surging higher into the end of the year:


For Q2’s HVI result, I removed Balyasny Asset Management and Tudor Investment Corp. from the HVI due to my newly added rule of only including funds focused on common shares, not options. The removed funds were replaced by Yacktman Asset Management and Man Group, with 13F AUMs of $10.54 billion and $32.41 billion, respectively.
Appaloosa’s David Tepper: Wall Street Biggest Bull

Let’s just take a quick detour into David Tepper’s 13F, which showed an incredible overall exposure increase of 165%. From 1993 to 2018, the veteran fund manager averaged an annual return of 25%. In 2020, Appaloosa began the process of returning external capital to its clients in light of its plans to become a family office.
Tepper increased his exposure in 30 of his 39 total positions. His total 13F exposure increased to $5.38 billion from $1.89 billion, marking a staggering increase of 184.70% and the highest since Q1 of 2021.


Appaloosa’s largest buys by value were NVDA 0.00%↑, BABA 0.00%↑, MSFT 0.00%↑,AMD 0.00%↑, and NVDA 0.00%↑. Its largest sales were CRM 0.00%↑, CEG 0.00%↑, XLF 0.00%↑ puts, HCA 0.00%↑, and, to the dismay of some, TSLA 0.00%↑.
You can read more on Tepper here:

Aggregate 13F Filer Data
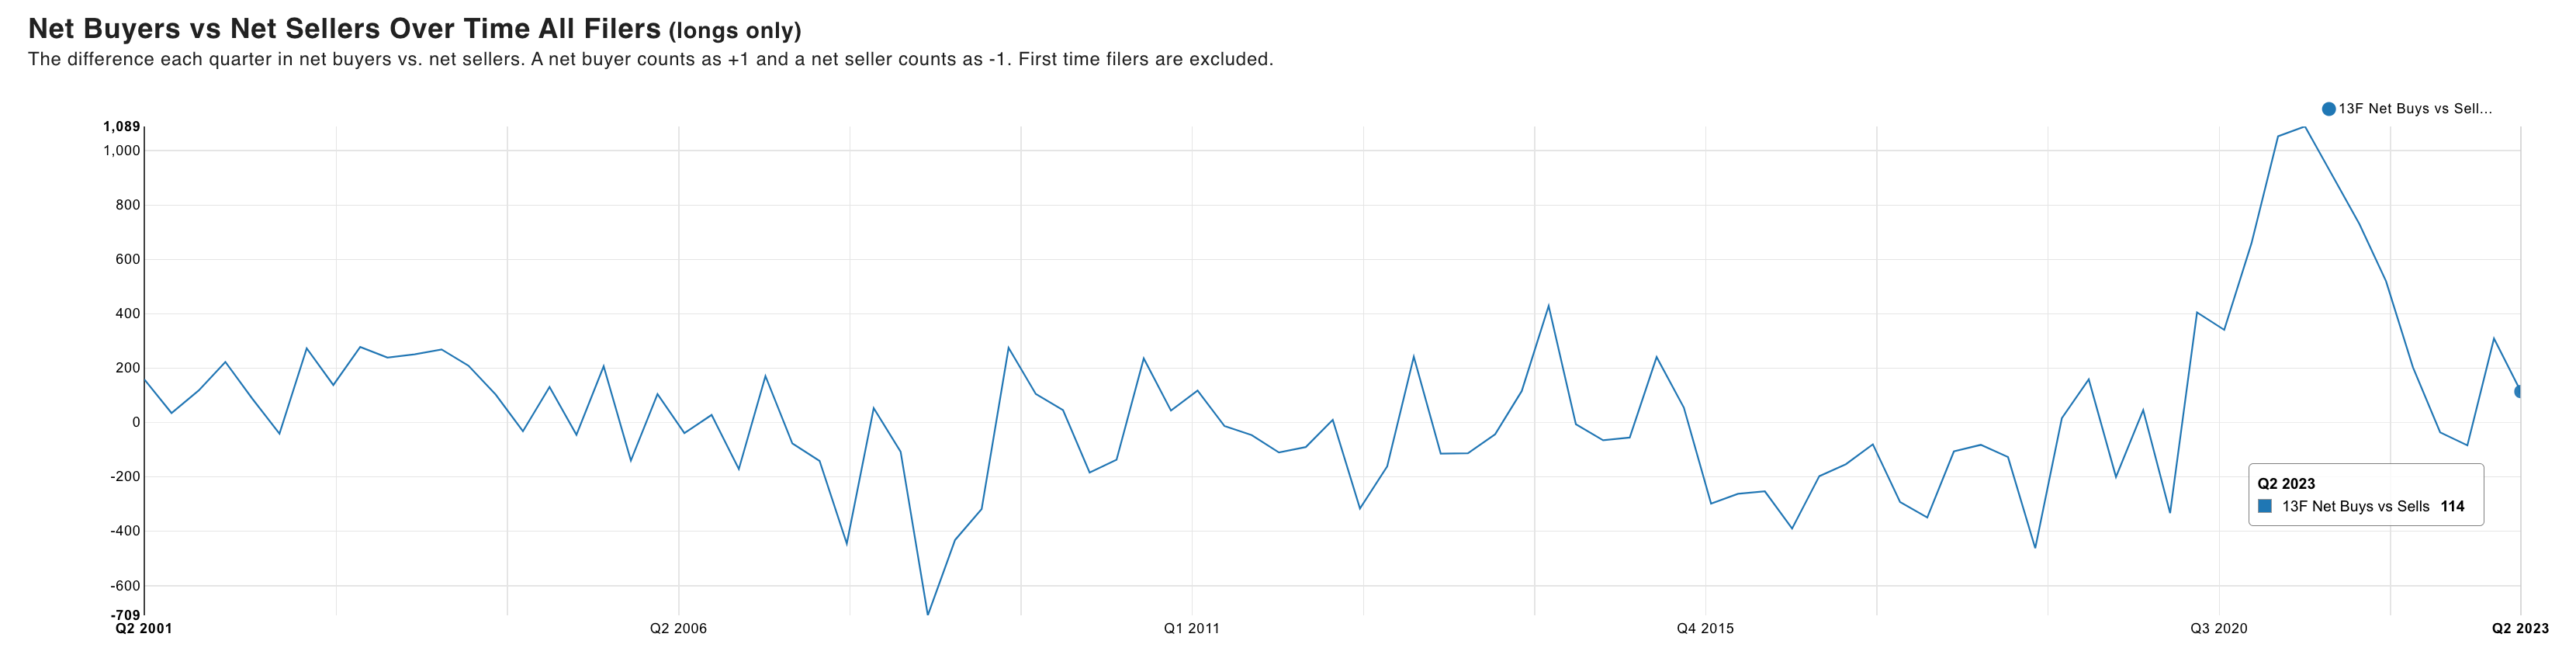
To gauge the activity of the overall institutional industry, we can track the total market value of all 13F long positions:

During Q2, the market value among long only filers increased to $40.5 trillion from $38.2 trillion, up by 6.02%. This marked the third consecutive quarter of growth, which began in Q4 of 2022.
At the same time, net buyers less net sellers declined to 114 compared to 309 during Q1, but still remained positive. In the chart, each net buyer counts as +1, while each net seller counts as -1:
Hedge Fund are Cautiously Optimistic
Overall, hedge funds appeared cautiously optimistic heading into the third quarter. This is likely attributed to seasonality, taking gains off the table, and the risk of sticky inflation, which would increase the risk of higher interest rates for longer.
I wouldn’t bet against the market here, though. If seasonality is responsible for the S&P 500’s recent 5% decline, a move to the upside into the end of the year would reward patient investors.
We can also look at the NAAIM Exposure Index, which tracks market exposure among active investment managers. The index shows that these managers have reduced net exposure by more than 40% since late July, in correlation with the 5% drop in the S&P 500.
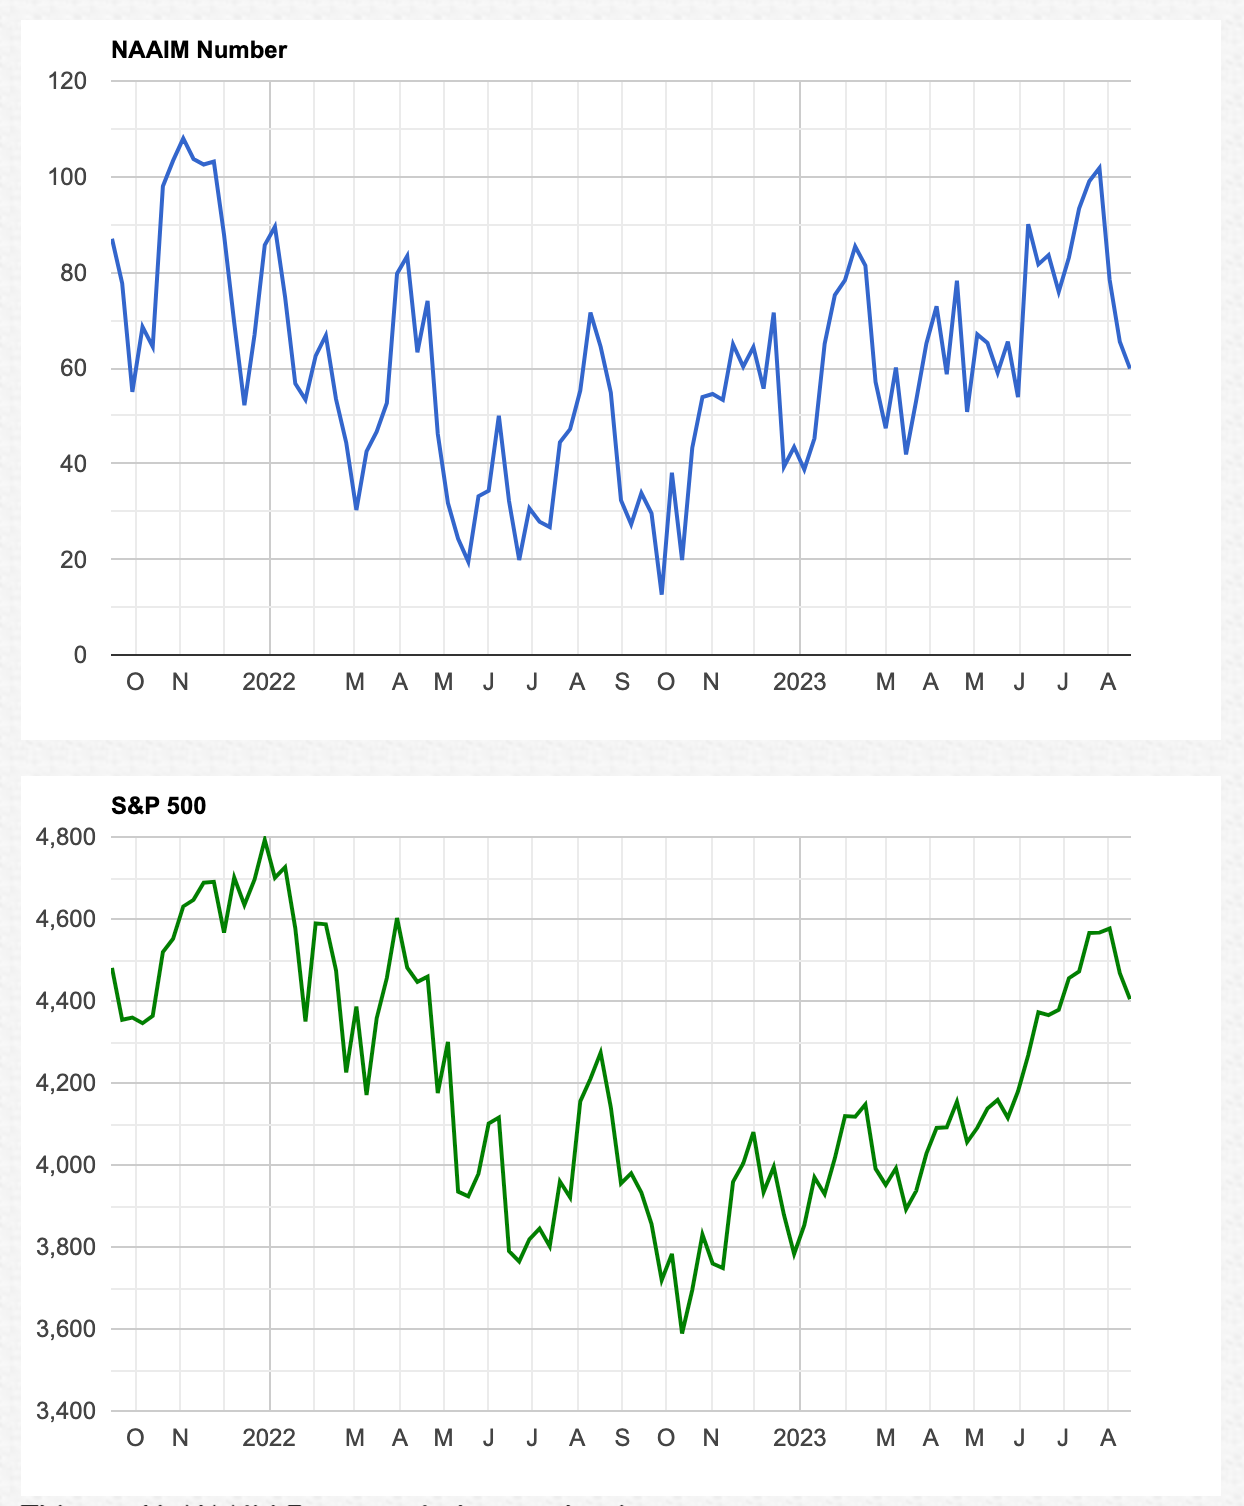
In the event of a move higher towards the end of the year, fund managers on the sideline may be pressured to bump net exposure higher, which could drive even further gains. While it appears that the market bottomed in 2022, many managers are still hesitant to invest due to their belief in the contrary. As long as interest rates remain high amid a yield curve inversion, talks of a recession will remain rampant.
Since 1969, the yield curve inversion has preceded every U.S. recession with an average delay of about 15 months. At the same time, not every inversion has preceded a recession since 1969. The yield curve has been inverted since July of 2022, while the S&P 500 has returned about 14% since then (not including dividends). 15 months after July of 2022 gets us to October of this year.

At the end of the day, I live by the motto: Time in the market beats timing the market. No one, and I mean no one, can predict what the economy and market will do with 100% certainty. As a result, sometimes its best to tune out the noise from the infinite number of market indicators and invest in appropriately valued companies with the best long term potential.
Hedge Vision - Institutional Insights
Please don’t hesitate to send me topic recommendations, suggestions, or general questions. You can contact me by email: HedgeVisions@gmail.com, or by Twitter messages: @HedgeVision
Great stats and perspectives!! Really enjoyed reading.