

S&P 500: A Contrarian Take
S&P 500: A Contrarian Take
No, I am not bearish.
I would like to preface this piece by saying I am NOT bearish at the moment. The trend and path of least resistance is up, and I am mostly invested with about 17% of my portfolio in cash. I always like to keep some cash on hand in case unexpected, attractive opportunities arise.
I believe the biggest bear case as of now is inflation and rising rates in long-dated treasury bonds. Theoretically, risk-free assets having higher rates will make stocks (and more specifically growth stocks) less attractive, causing a selloff in equities and an increase in demand for bonds. However, I do not believe this thematic will play out, and I believe inflation fears are just unnecessary noise that should be ignored in the big picture of historical returns. I have not adjusted my portfolio at all due to rising rates or inflation concerns.
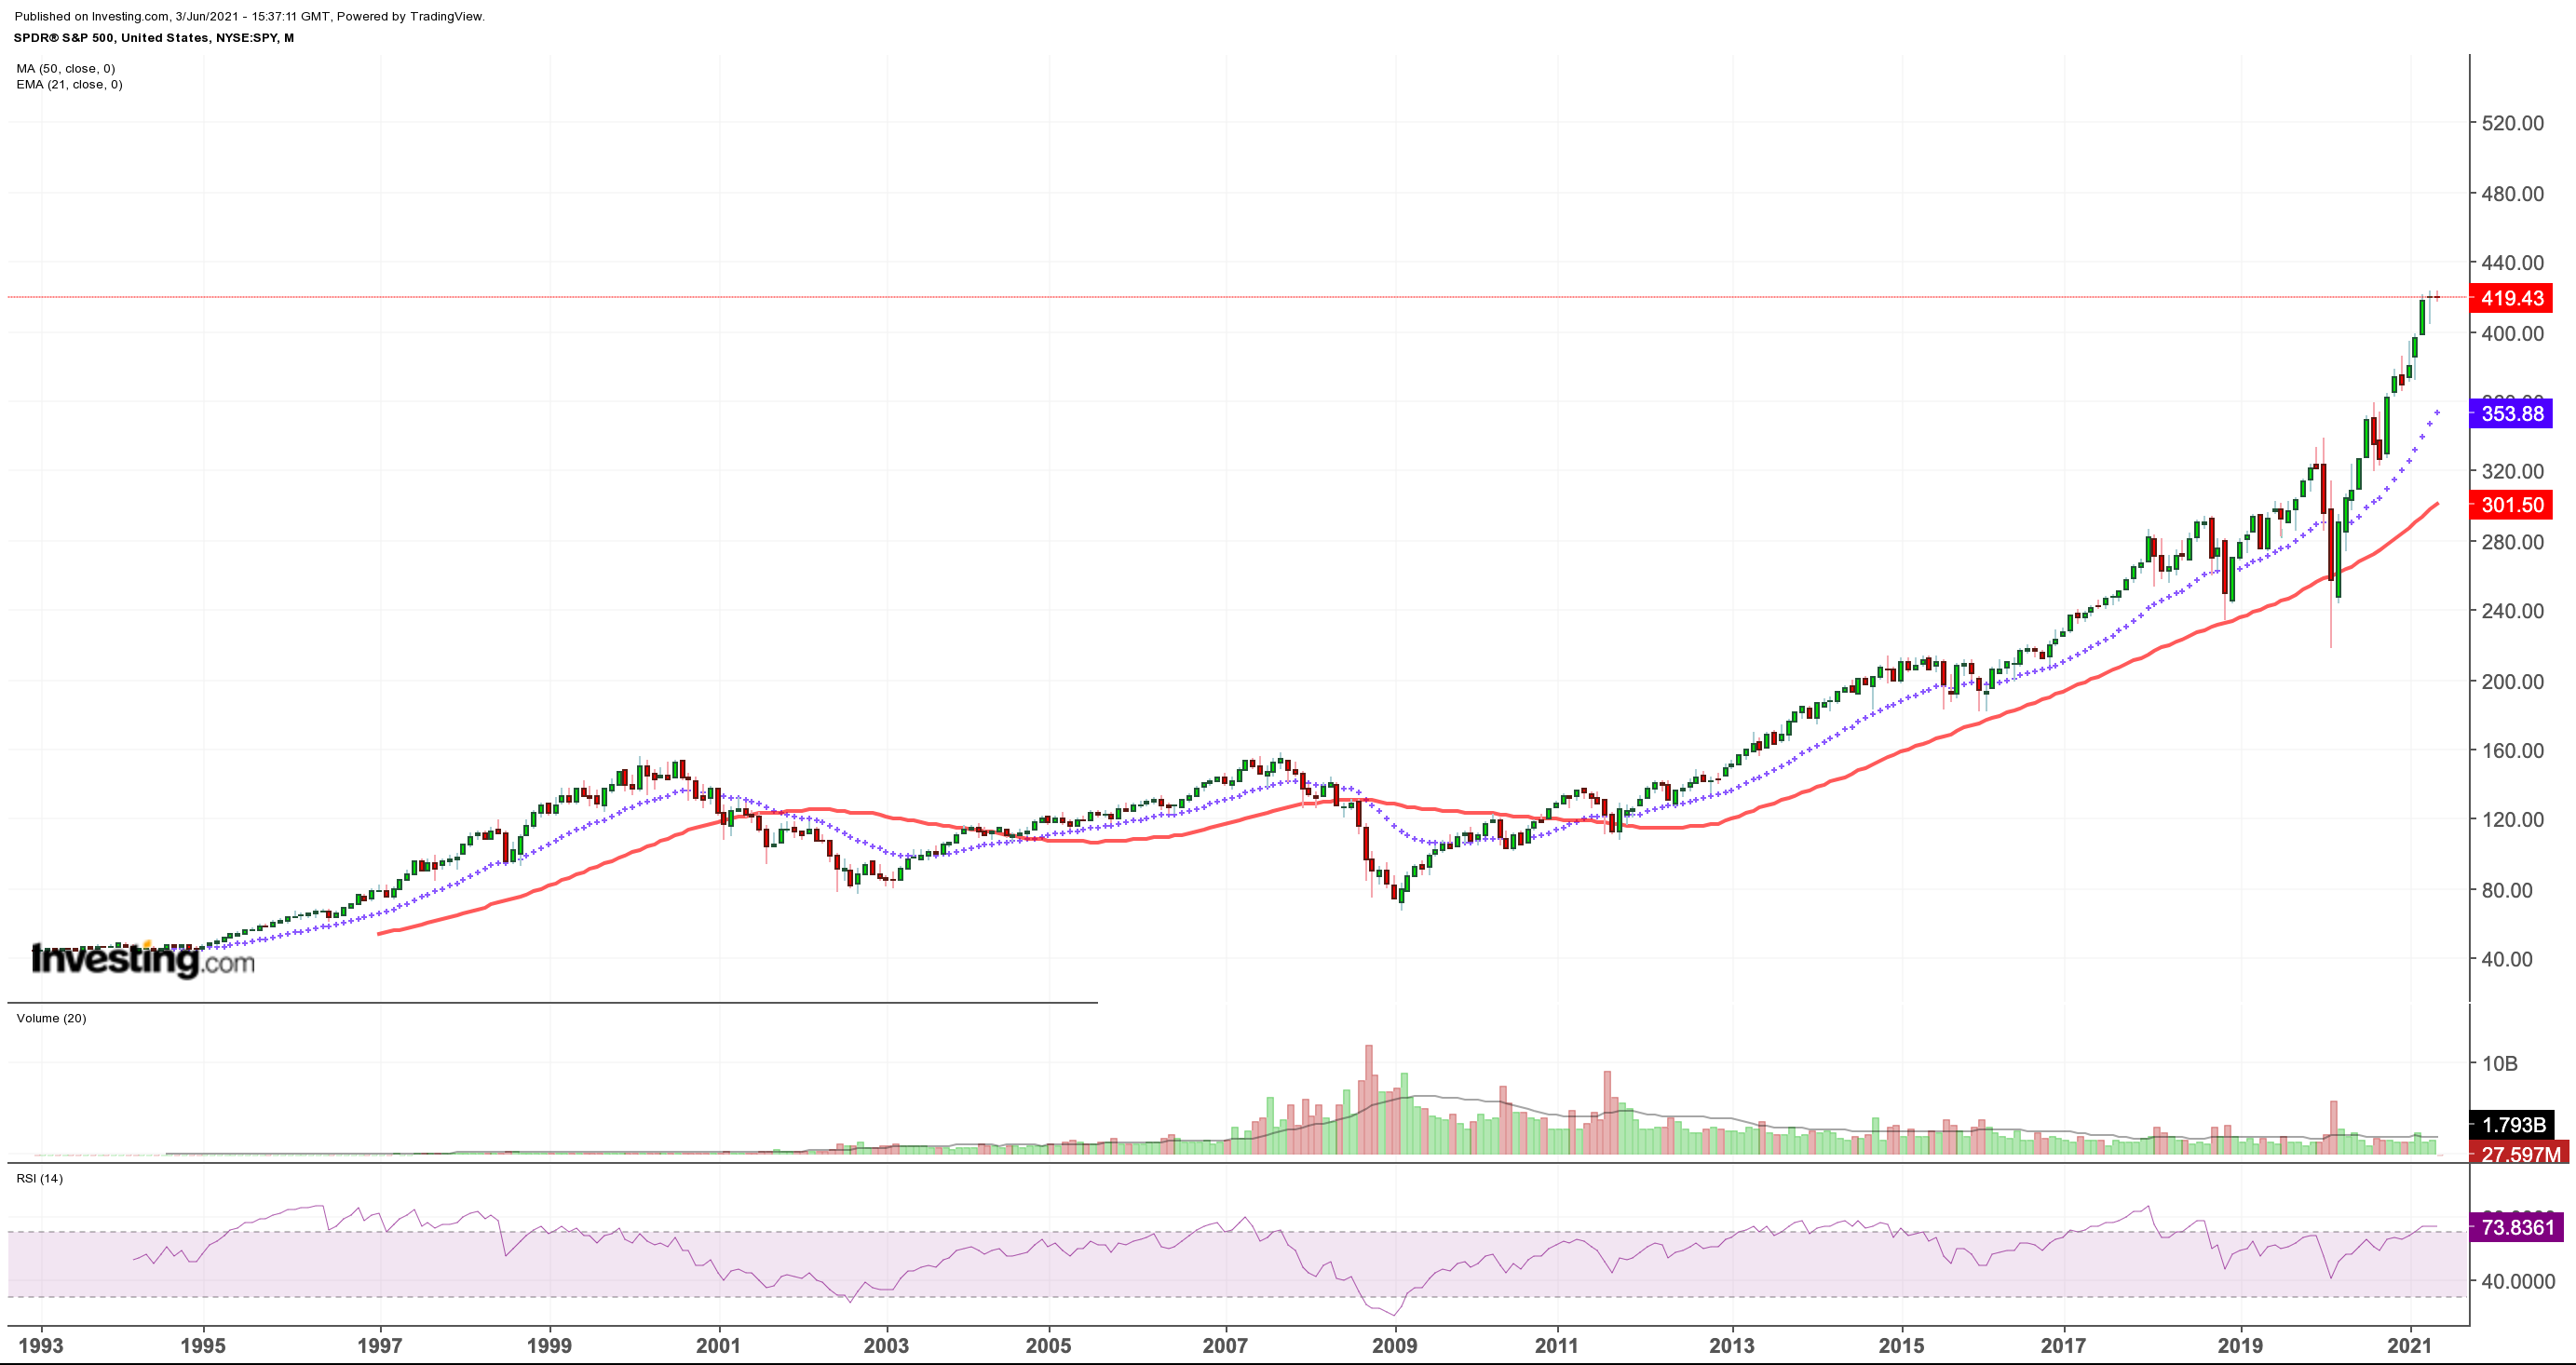
Dotted Blue Line: 21 Month Exponential Moving Average (EMA)
Red Line: 50 Month Simple Moving Average (SMA)
Every once in a while, I like to zoom out of major indices and view them on the 1 month timeframe, as it gives me a simple, less noisy view of the chart. Looking at the S&P 500 1M chart, you can see that price ALWAYS reverts back to the 21M EMA or the 50M SMA, whether it be price retracing there or the moving averages catching up. The S&P500 is currently at $419.43.
A Reversion to the 21M EMA at $353.88: -15.63%
A Reversion to the 50M SMA at $301.50: -28.12%
The last time the S&P 500 fell to the 50M SMA was March of 2020. While it blew past the 50M SMA, the index managed to recover a bit and barely closed below it in the same month. The next month, the S&P500 rose 17.14%. The 50M SMA is an extremely important support/resistance point for the index, and I view any drops to the 50M SMA as a great buying opportunity.
S&P 500 prices have only stayed under the 50M SMA for a sustained period of time on two times since 1993: from 2001-2003 and late 2008-2011.
It is never beneficial to view just one indicator by itself; indicators are much better when used in conjunction. However, it is worth noting that RSI is currently outstretched at 73.83 on the 1M timeframe.
Bull Case: Historically, RSI can stay elevated above 70 for several years on the 1M timeframe. RSI stayed above 70 from June 1995 to August 1998. Additionally, from March 2013-December 2014.
Bear Case: High RSI, coupled with price being way above the 21M EMA and 50M SMA can force a reversion down to the mentioned moving averages. Either inflation/rising rates, the Fed raising the Federal Funds rate (unlikely to happen in the near time), or an unexpected black swan event (like coronavirus) will lead us there.
The recent bull run after the March 2020 coronavirus selloff seems to be almost vertical in comparison with past bull runs. However, trying to time the market based off of this fact has proved to be fruitless so far, as the market keeps making new highs. In my earlier investing career, I would try to time the market by buying UVXY or SQQQ. I’ve lost money countless times trying this, so I no longer try to time the market with these strategies.
For Your Eyes Only - Hedge Fund Insights
Macro analysis paired with technicals. I love it!